The Challenge
Project Alpha had no single source of truth. Project health, utilization rates, revenue forecasting, and client satisfaction data all lived in separate spreadsheets managed by different team leads. The CEO was making quarterly decisions on month-old data. Leadership needed real-time visibility without replacing every tool the team already used.
The Approach
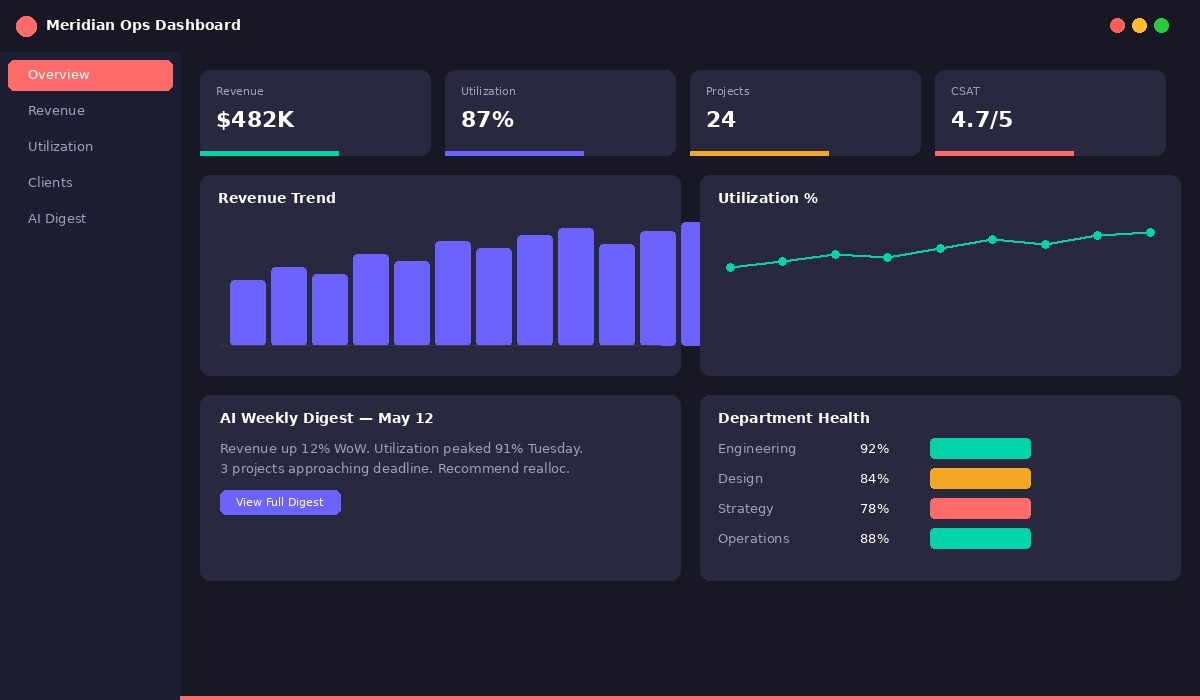
I ran a 2-week stakeholder discovery process (facilitated in Miro) to identify the 15 KPIs that actually drove decisions. All requirements were tracked in Jira, and the process was documented in Confluence end-to-end. Then I built data pipelines pulling from the firm's existing stack (HubSpot, Harvest, QuickBooks, Google Sheets), normalizing everything into a PostgreSQL warehouse. The dashboard frontend uses React with Recharts for interactive visualizations. The standout feature: an AI-powered weekly digest that analyzes KPI trends and delivers a plain-English executive summary every Monday morning.
Platforms & Tools Used
This engagement used a full professional BA/PM stack: from discovery and process mapping through delivery and documentation.
Project Stages
Ran 8 stakeholder interviews across 4 departments using structured interview guides. Built a shared Miro board to collaboratively map data sources, decision flows, and pain points. Defined 15 priority KPIs with clear owners and data provenance.
Designed ETL pipelines connecting HubSpot, Harvest, QuickBooks, and Google Sheets into a unified PostgreSQL warehouse. Documented every data contract in Confluence so the team could maintain it independently after handover.
CRM
Python
Warehouse
React
Time
Pandas
Claude API
Finance
API
Built the interactive dashboard in React + Recharts with role-based views per department. Ran 3 UAT cycles tracked in Jira; each round refined KPI cards, chart types, and alert thresholds based on real leadership feedback.
Integrated the Claude API to generate a plain-English weekly digest every Monday morning. The AI analyzes cross-KPI trends, surfaces anomalies, and writes a 5-bullet executive summary, eliminating 6 hours of manual reporting per week.